Blockchain Pulse
Blockchain Pulse: An interactive digital art installation that visualizes real-time Starknet transactions. Each transaction is dynamically represented through unique colors, shapes, and movements, creating an ever-evolving visual experience. #Blockchain #Art #Starknet
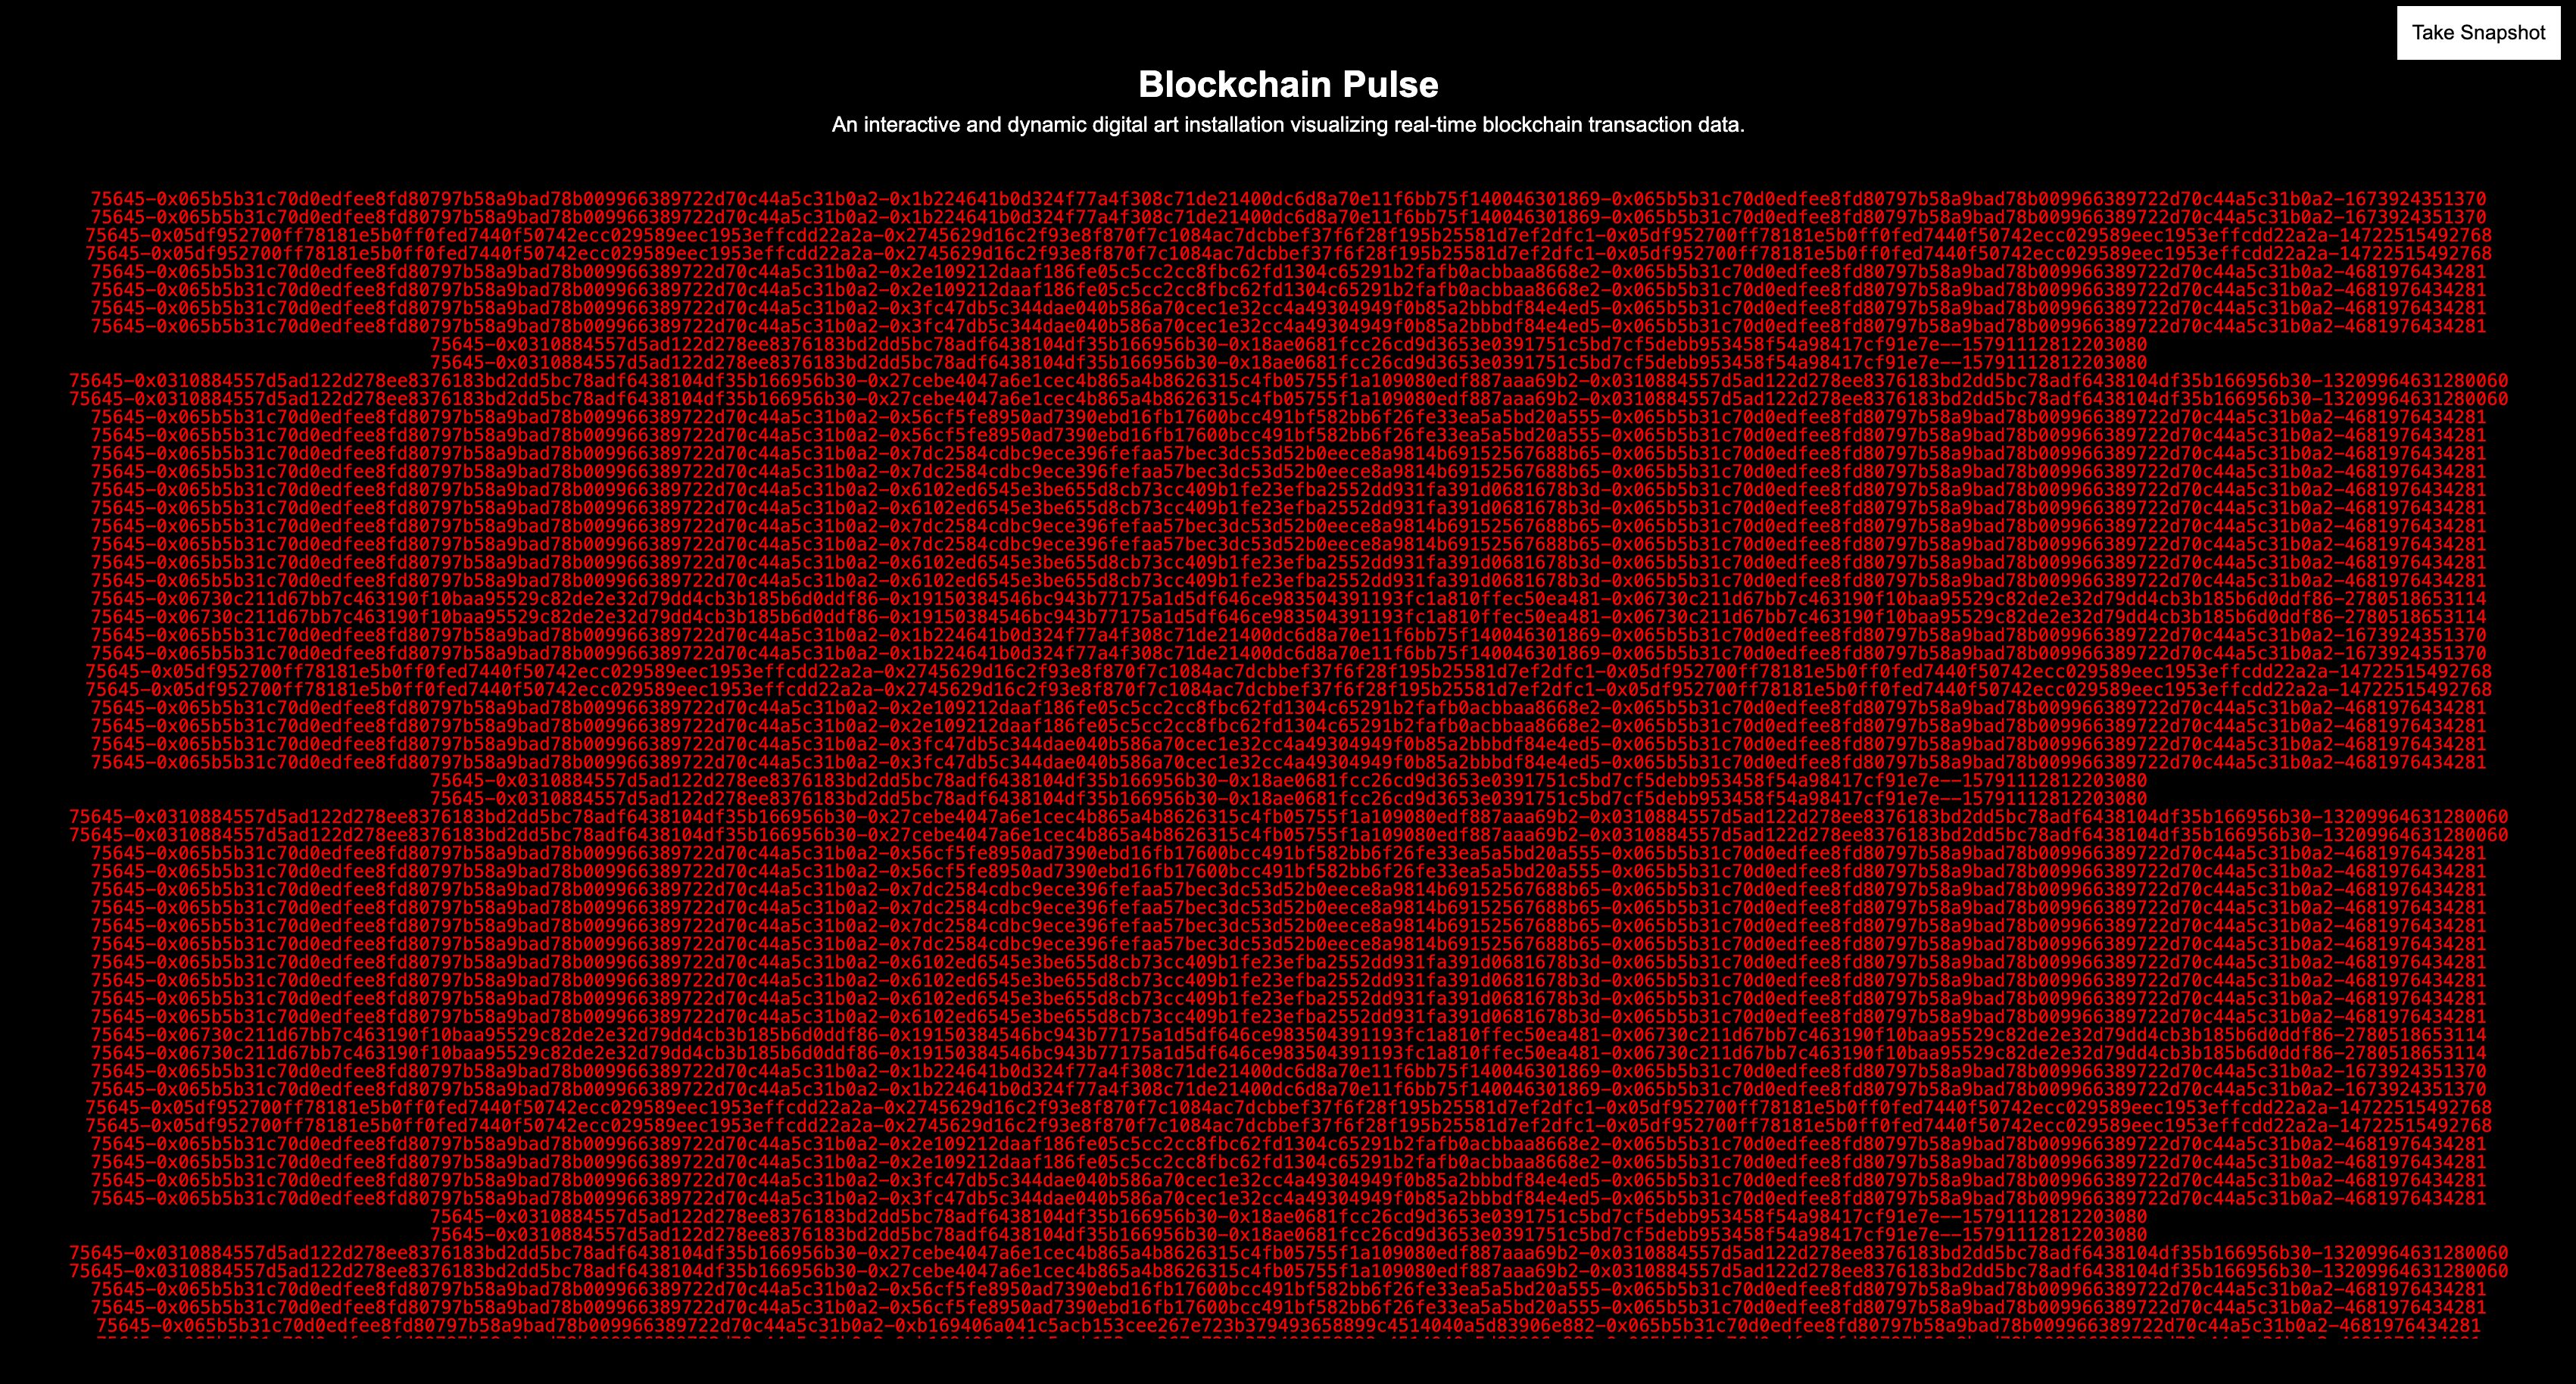
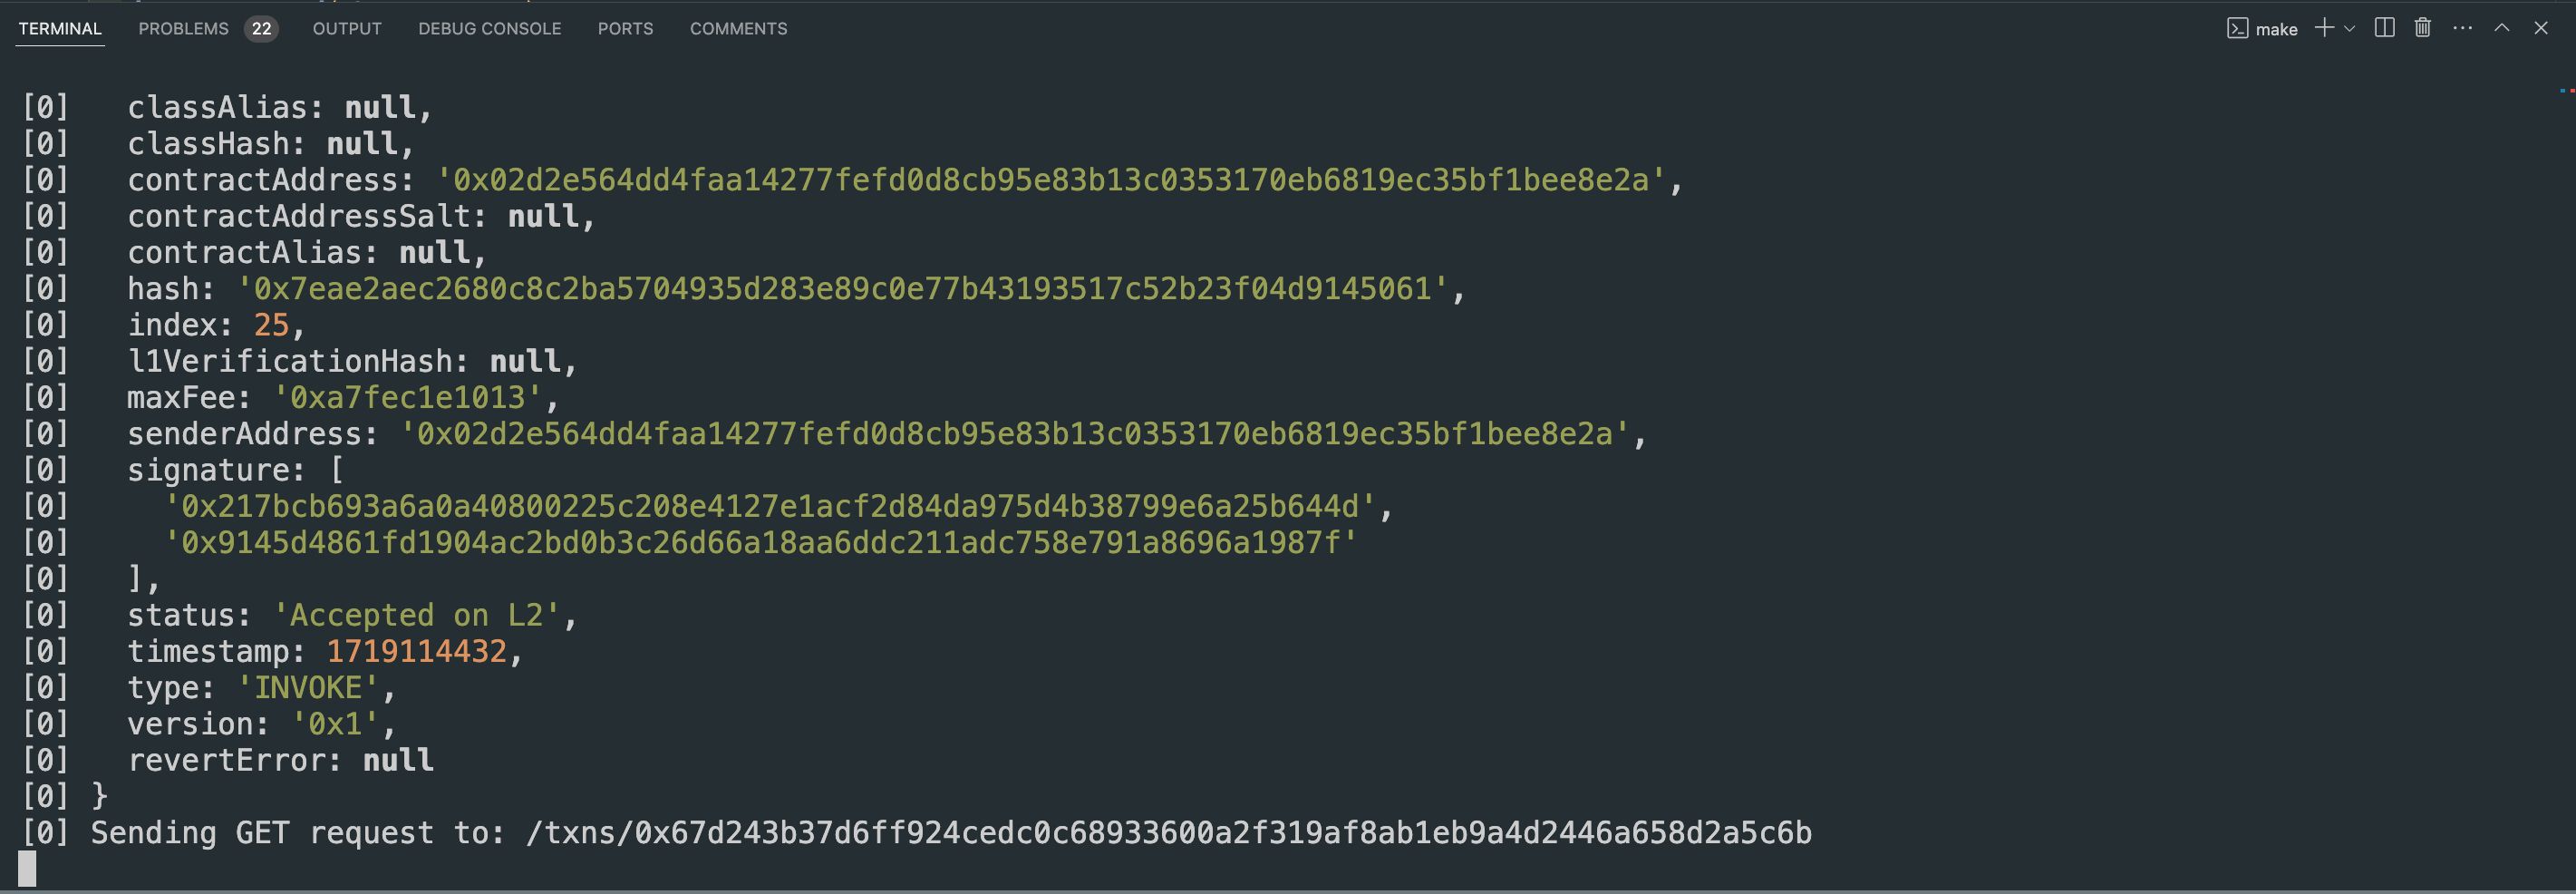
Screenshots
Problem Statement
Blockchain Pulse is an interactive and dynamic digital art installation that visualizes real-time blockchain transaction data. Inspired by Tatsuo Miyajima's "Keep Changing, Connect with Everything, Continue Forever" this project transforms live transaction data from Starknet into ever-changing visual patterns. Each transaction is represented by unique colors, shapes, and movements, creating a constantly evolving piece of digital art that highlights the continuous flow and activity within the blockchain.
Solution
Technologies UsedStarknet:Layer 2 Scaling: Starknet is used as the primary blockchain network for its scalability and efficiency. It enables fast and low-cost transactions which are essential for real-time data processing.Smart Contracts: Written in Cairo, Starknet's native language, these contracts facilitate the collection and management of transaction data.Voyager API:Data Retrieval: The Voyager API is crucial for accessing Starknet's real-time transaction data. It ensures that the data used for visualization is accurate and up-to-date.Integral Integration: The Voyager API is a core component of our project, providing the essential data needed to generate the dynamic visual art. Without this API, real-time updates and accurate data representation would not be possible.React:User Interface: React is used to build the front-end interface that displays the dynamic visualizations. It provides a responsive and interactive user experience.Socket.IO:Real-Time Communication: Socket.IO is used for real-time communication between the back-end and front-end. This ensures that any new transaction data fetched by the back-end is instantly reflected in the visualizations.Architecture and IntegrationData Pipeline:The project uses a pipeline to continuously fetch transaction data from Starknet using the Voyager API.The data is processed in real-time by the back-end server and sent to the front-end application via WebSockets.Visualization Layer:Processed data is fed into the front-end application where D3.js and Three.js generate the visual elements.Each transaction is represented by unique colors, shapes, and movements based on predefined algorithms that map data attributes to visual properties.Interactivity:The user interface allows viewers to interact with the visualization. For example, users can hover over or click on elements to get more information about specific transactions.The interface is designed to be intuitive, providing a seamless experience that encourages exploration and engagement.Hacky and Notable FeaturesReal-Time Updates: Implementing real-time updates required optimizing the data fetching and processing pipeline to handle large volumes of transactions without lag.Voyager API Integration: The use of the Voyager API was central to our project, providing the necessary transaction data to drive the visualizations. This integration demonstrates the API's capability to support real-time, high-volume data applications.Dynamic Visual Mapping: The algorithms used to dynamically map transaction data to visual properties were fine-tuned to create aesthetically pleasing and meaningful representations.
Hackathon
StarkHack
2024
Prizes
- 🏆
Voyager API
Voyager
Contributors
- susumutomita
30 contributions
- dependabot[bot]
11 contributions
- github-actions[bot]
2 contributions

![dependabot[bot]](https://avatars.githubusercontent.com/in/29110?v=4)
![github-actions[bot]](https://avatars.githubusercontent.com/in/15368?v=4)