L2Dashboard
Dashboard similar to L2Beats that shows the status of L2s using data from Defillama
Screenshots
Problem Statement
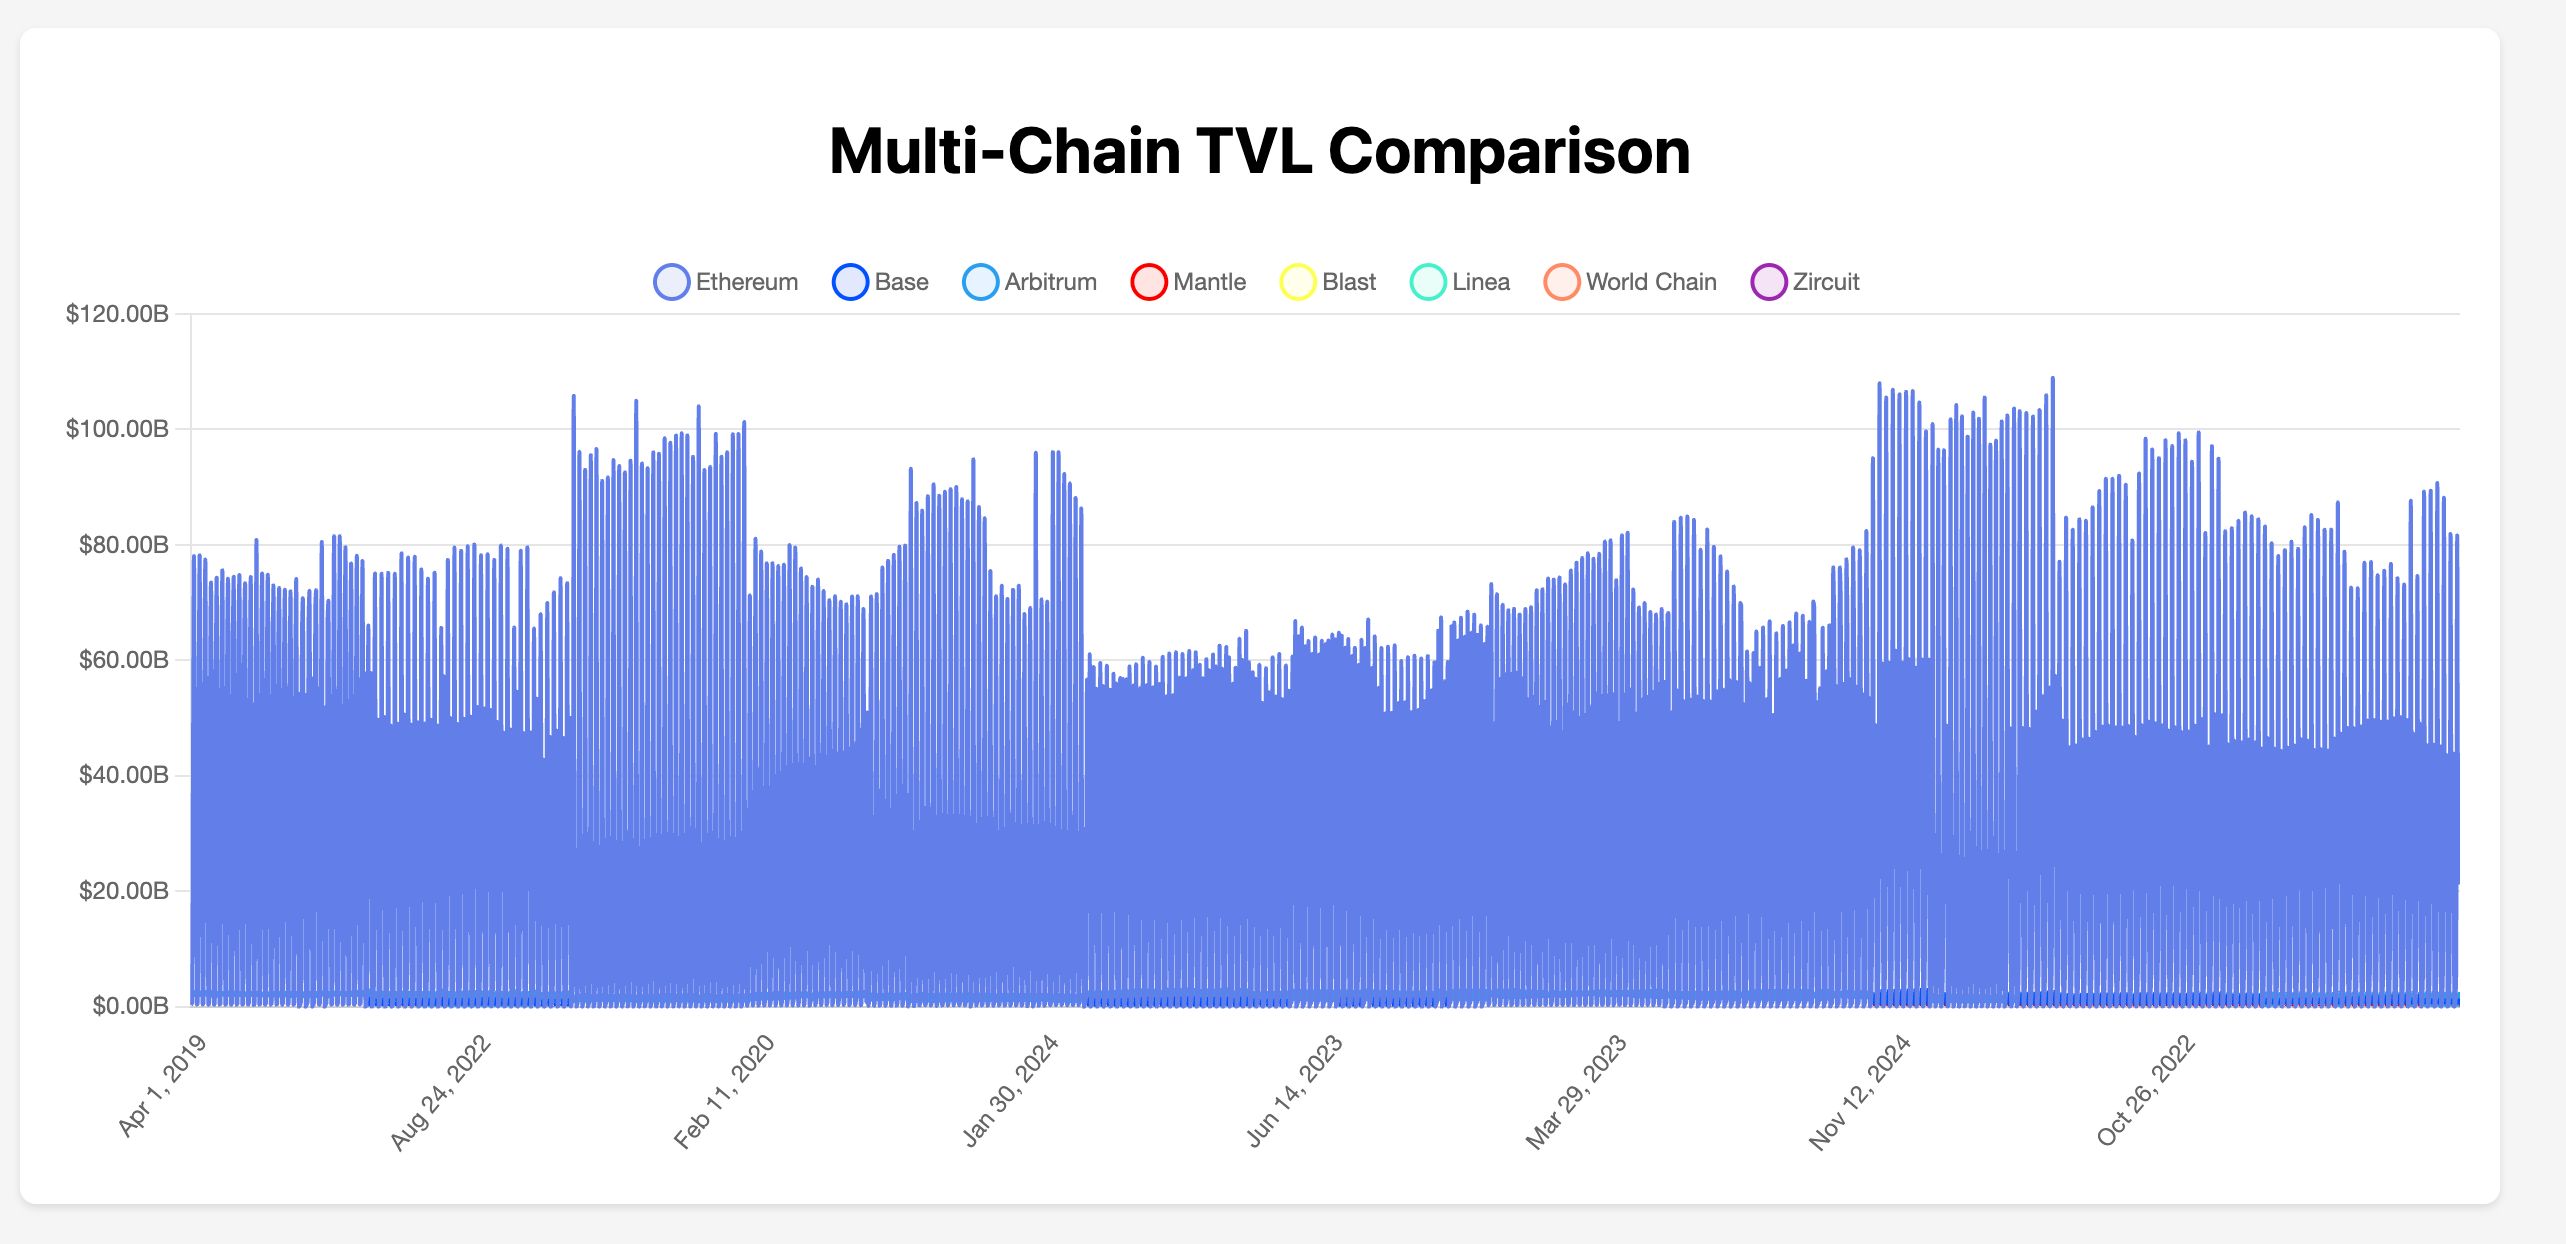
This project serves as a tool for understanding the distribution and evolution of value locked across different blockchain networks, providing insights into the growth and adoption of various Layer 1 and Layer 2 solutions in the blockchain ecosystem. It's used to get an understanding of how L2beats can be built using open source data.
Solution
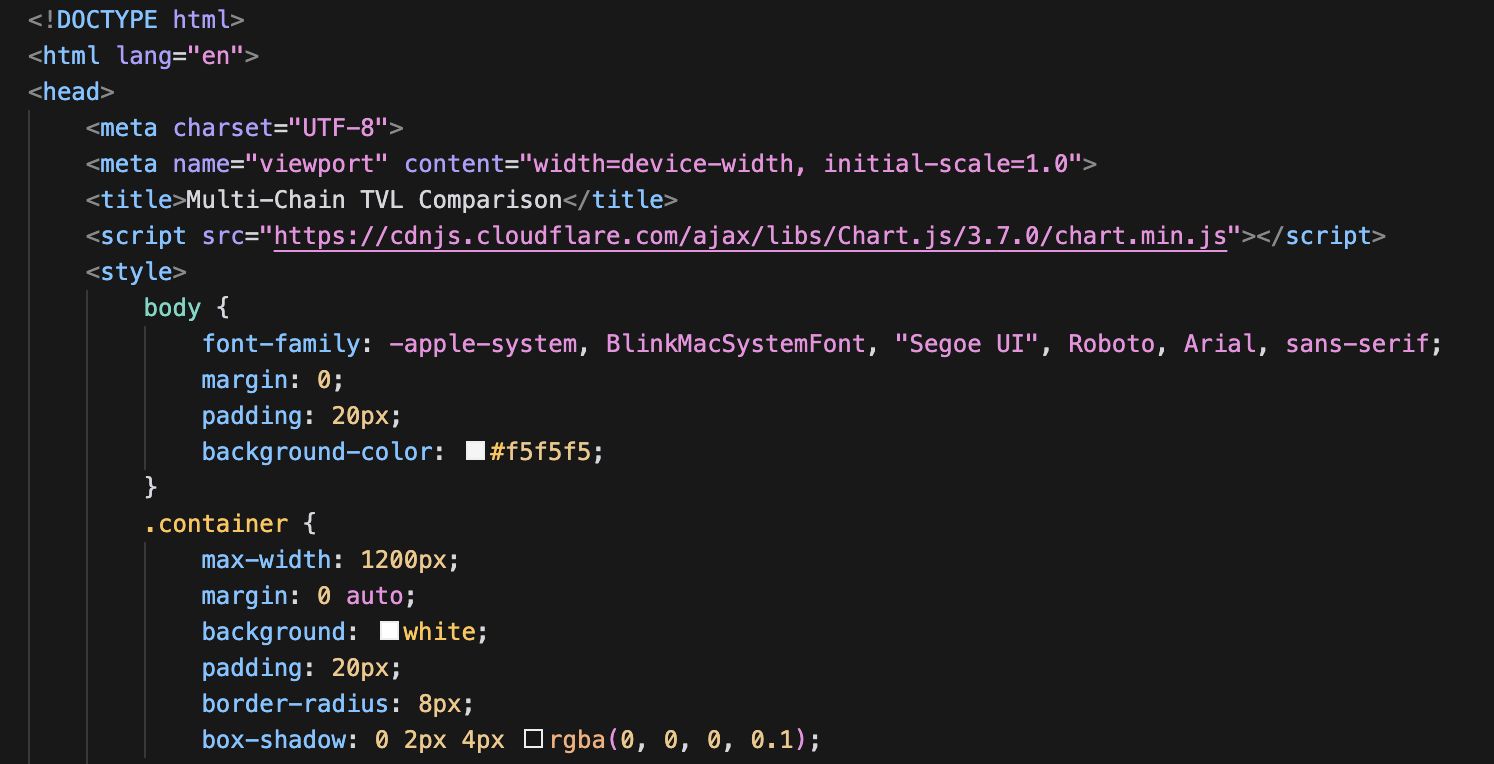
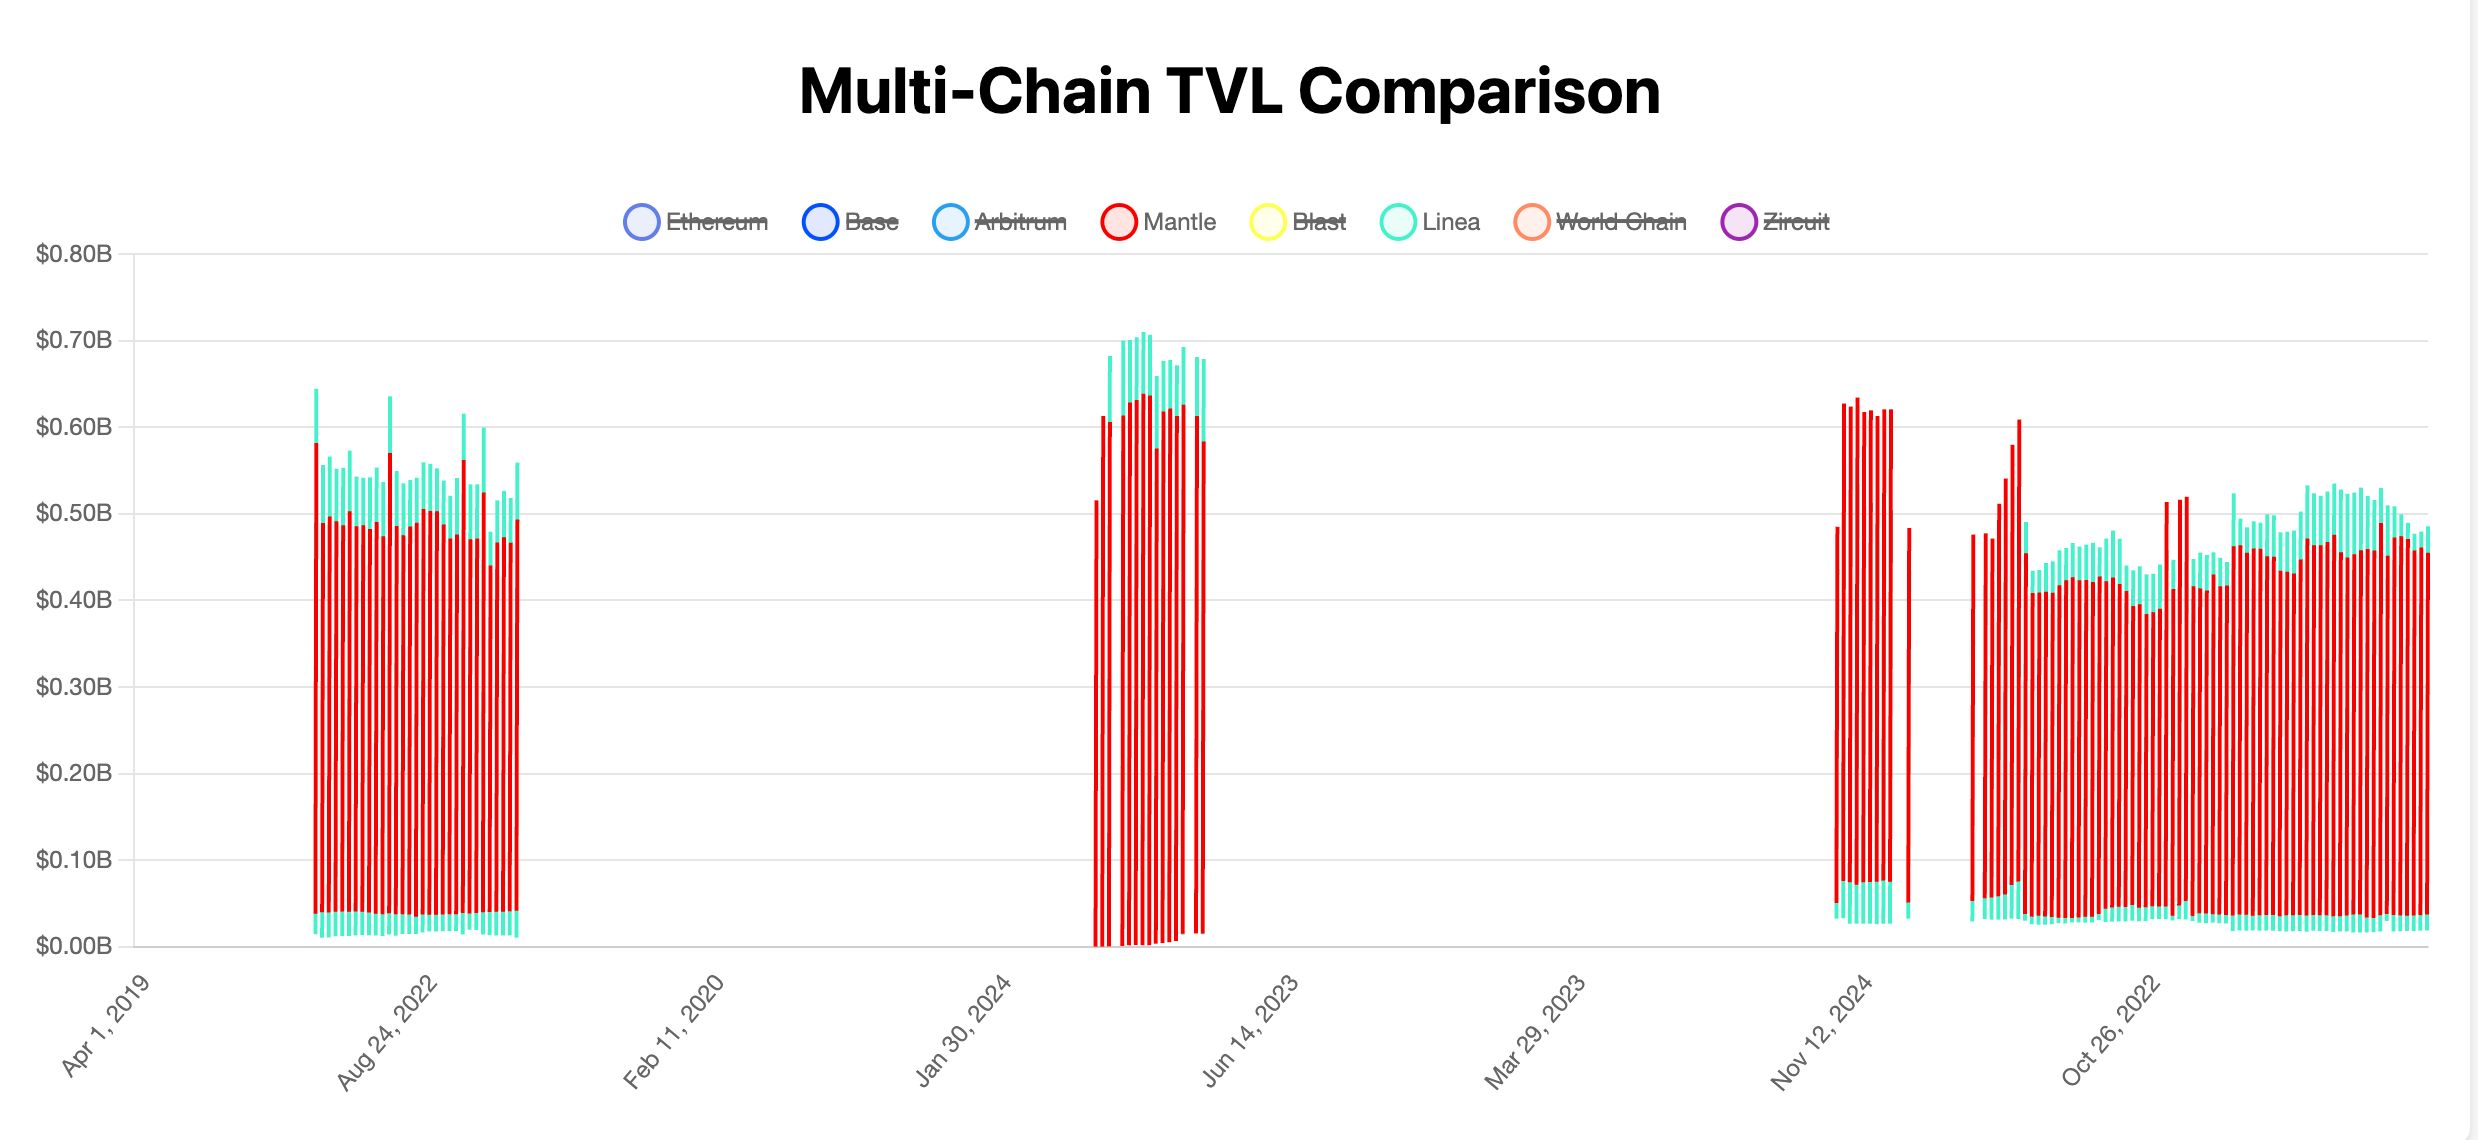
L2Beats-style Data Dashboard for L2sProject Overview This project is a web-based dashboard that visualizes and compares Total Value Locked (TVL) across multiple blockchain networks. It provides a real-time, interactive visualization of how much value (in USD) is locked in various blockchain protocols over time.Technical ArchitectureUses the DeFi Llama API (api.llama.fi) to fetch historical TVL data Endpoint: https://api.llama.fi/v2/historicalChainTvl/{chainName} Data is retrieved for multiple chains including:Ethereum Base Arbitrum Mantle Blast Linea World coin ZircuitTechnical StackPure HTML/JavaScript implementation (no frameworks) Chart.js library for data visualization Responsive design using modern CSS All-in-one single page applicationInteractive ElementsHover tooltips showing exact TVL values Clickable legend to toggle individual chains Responsive x-axis with auto-scaling date labels Dynamic y-axis labels converting values to M/B (millions/billions)Data ProcessingAutomatic conversion of Unix timestamps to readable dates TVL normalization to millions/billions for readability Handling of missing or null values Error handling for failed API requests Minimum value threshold to prevent logarithmic scale issues
Hackathon
ETHGlobal Bangkok
2024
Contributors
- this-username-is-taken
4 contributions
