MyOptions
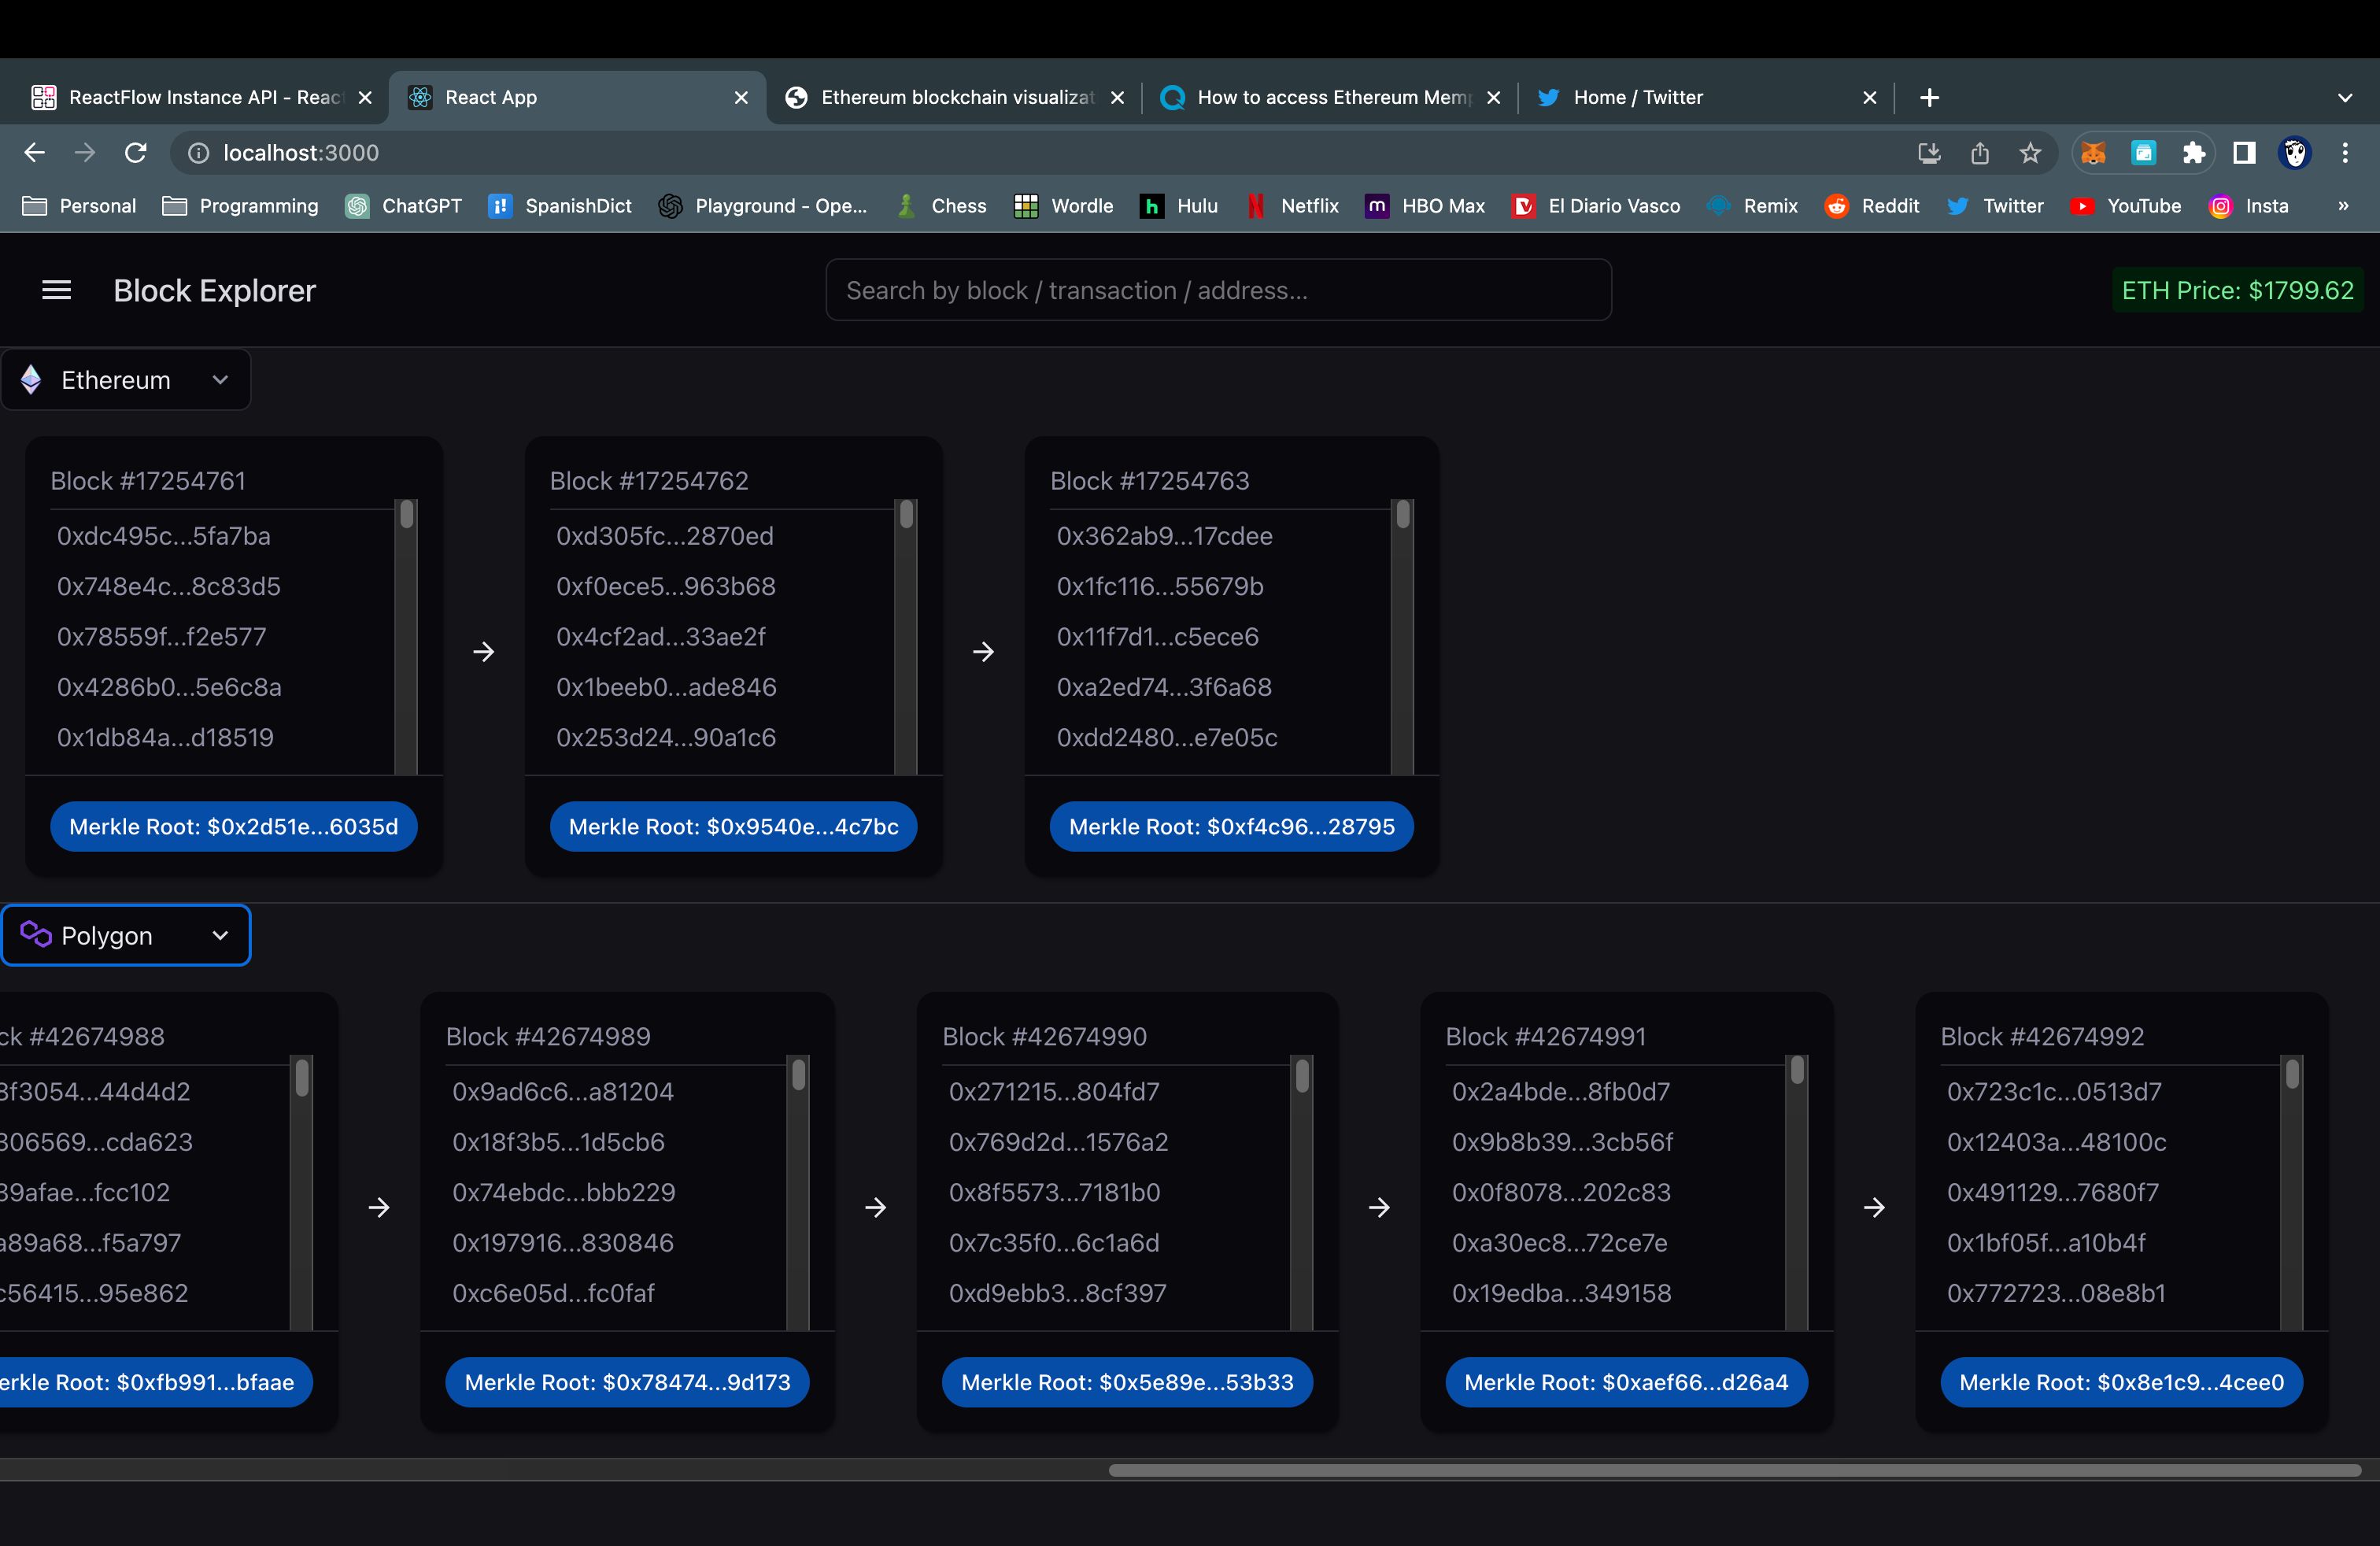
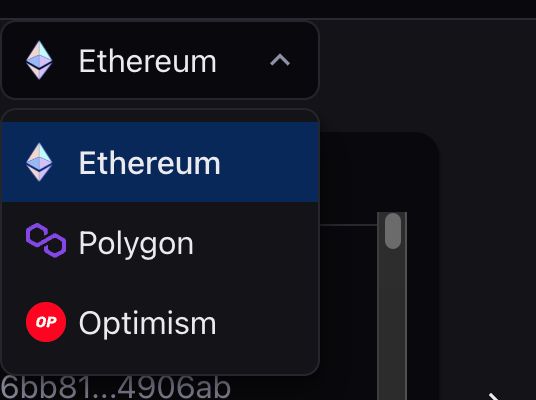
A block visualizer that allows you to see how different rollups interact with the ethereum.
Screenshots
Problem Statement
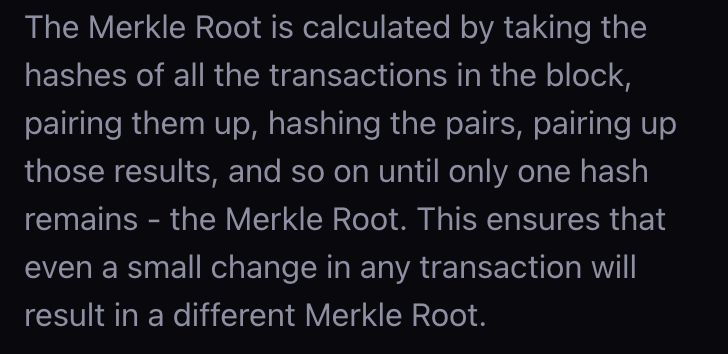
This project displays freely and publically avaliable data that is constantly emitted, and displays it in a way that is easy to understand and learn from. As data is emitted from the selected chains, it shows a preview-blob of block information, so you can get a feel for what is happening on chain.Data displayed in this way helps to understand the fundamentals that make blockchains work, and I am excited to share it!
Solution
I am using a componenet library joy-ui, ethers, and an infura node to visualize different blockchains side-by-side. After playing around, I started rebuilding my project with the reactflow library, but I was short on time, so I retreated from that effort. I set up a listener and am using callbacks and react hooks in order to add new blocks as they are recieved.Since websocket providers aren't currently supported by infura nodes, I made a component,<BlockBeggar/>that spams requests, adptly for the given chain.
Hackathon
ETHGlobal Lisbon
2024